As I was wondering what would be the main subject I should start writing my blog with, EDA popped up to my mind in no time. Logically fitting, isn’t it?! Why? Why? Soon you’ll find out!
INTRODUCTION
One of the best methods used in Data Science today is Exploratory Data Processing. People usually do not know the distinction between Data Analysis and Exploratory Data Analysis before beginning a career in Data Science. Among the two, there is not a very significant gap, but both have separate purposes.
Many data scientists would agree that the more you compile, study and analyze, the more you want to learn, the easier it is to get lost in data. Data scientists delve into these massive databases and spend hours extracting, modeling and interpreting them.
What is EDA?
Exploratory Data Analysis (EDA) is an approach/philosophy for data analysis that employs a variety of techniques (mostly graphical) to
- maximize insight into a data set;
- uncover underlying structure;
- extract important variables;
- detect outliers and anomalies;
- test underlying assumptions;
- develop parsimonious models; and
- determine optimal factor settings.
EDA is typically used for these four goals:
- Exploring a single variable and looking at trends over time.
- Checking data for errors.
- Checking assumptions.
- Looking at relationships between variables.
To grasp the data first and strive to gather as much ideas from it is a healthy idea. Prior to getting them dirty with it, EDA is all about making sense with data in hand.
EDA explained using sample Data set:
I’ll take an example of Seattle Airbnb Open Data from Kaggle to share my interpretation of the idea and techniques I know, and try to capture as many insights using EDA from the data collection.
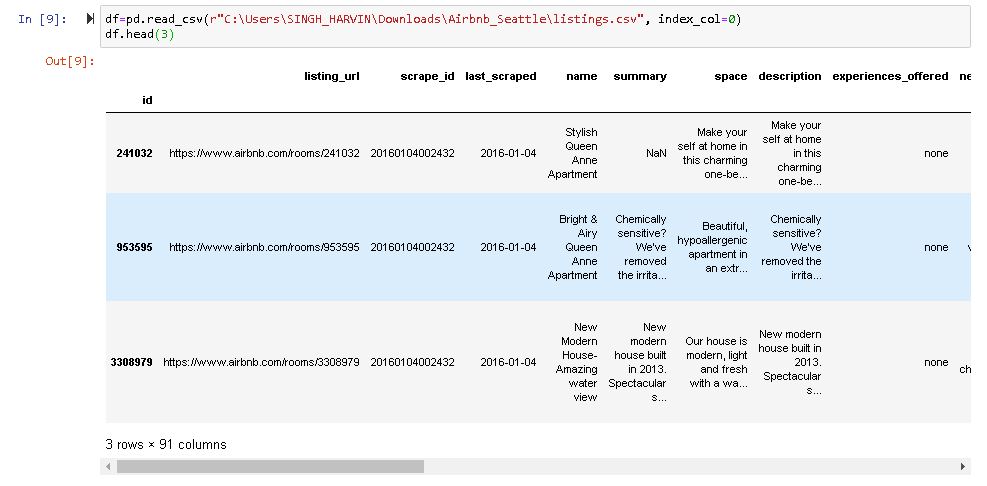
To begin with, I imported the required libraries (pandas, numpy, matplotlib and seaborn for this instance) and loaded the data set.
Note : Whatever inferences I could extract, I’ve mentioned with bullet points.
- Original data is separated by delimiter “ ; “ in given data set.
- To take a closer look at the data took help of “ .head()”function of pandas library which returns first five observations of the data set. Similarly “.tail()” returns last five observations of the data set.
I found out the total number of rows and columns in the data set using “.shape”.
- Dataset comprises of 3818 observations and 91 characteristics.
- Out of which eight are dependent variable and rest 83 are independent variables- Airbnb facilities description and reviews based on facilities available by Airbnb at Seattle.
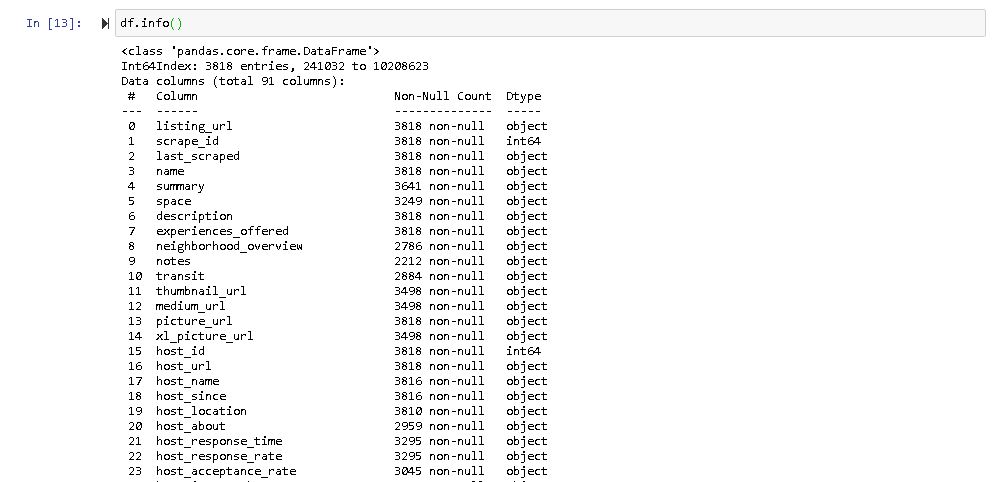
It is also a good practice to know the columns and their corresponding data types, along with finding whether they contain null values or not.
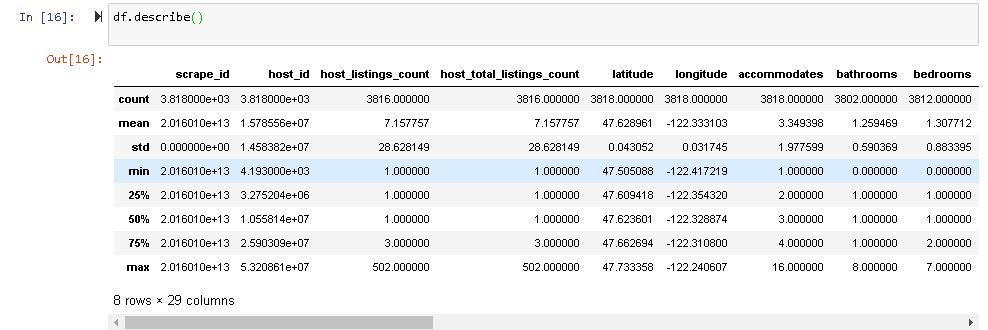
In pandas, the describe() function is very useful in having different summary statistics. This function returns the number, mean, standard deviation, minimum and maximum values, as well as the data quantities.
- Here as you can notice mean value is less than median value of each column which is represented by 50%(50th percentile) in “host_id” column.
- There is notably a large difference between 75th %tile and max values of predictors “host_id”, “host_listings_count”, “host_total_listing_count”.
- Thus observations 1 and 2 suggests that there are extreme values-Outliers in our data set.
CONCLUSION
All the measures referred to above are part of EDA. This is not EDA’s end. All the above steps are the basics that should be carried out before doing feature engineering or modeling to analyze the results.
I had a great glimpse of the data. But the more you get involved with Data Science, the harder it is for you to stop exploring.

